Gallery
Example 1: Multiple-Censored Data
The code:
import weibull
fail_times = [
42.1, 105.9, 151.3, 195.6,
77.8, 117.0, 157.3, 207.0,
83.3, 126.9, 163.8, 215.3,
88.7, 138.7, 177.2, 217.4,
101.8, 148.9, 194.3, 258.8
]
suspensions = [1, 0, 1, 1,
0, 0, 0, 0,
1, 0, 0, 1,
1, 0, 1, 0,
0, 0, 1, 1]
# this is where the actual analysis and curve fitting occur
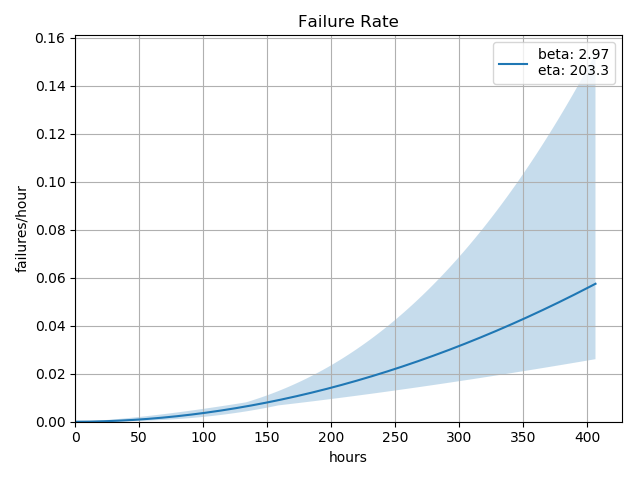
analysis = weibull.Analysis(fail_times, suspensions, unit='hour')
analysis.fit(method='mle', confidence_level=0.6)
print(analysis.stats)
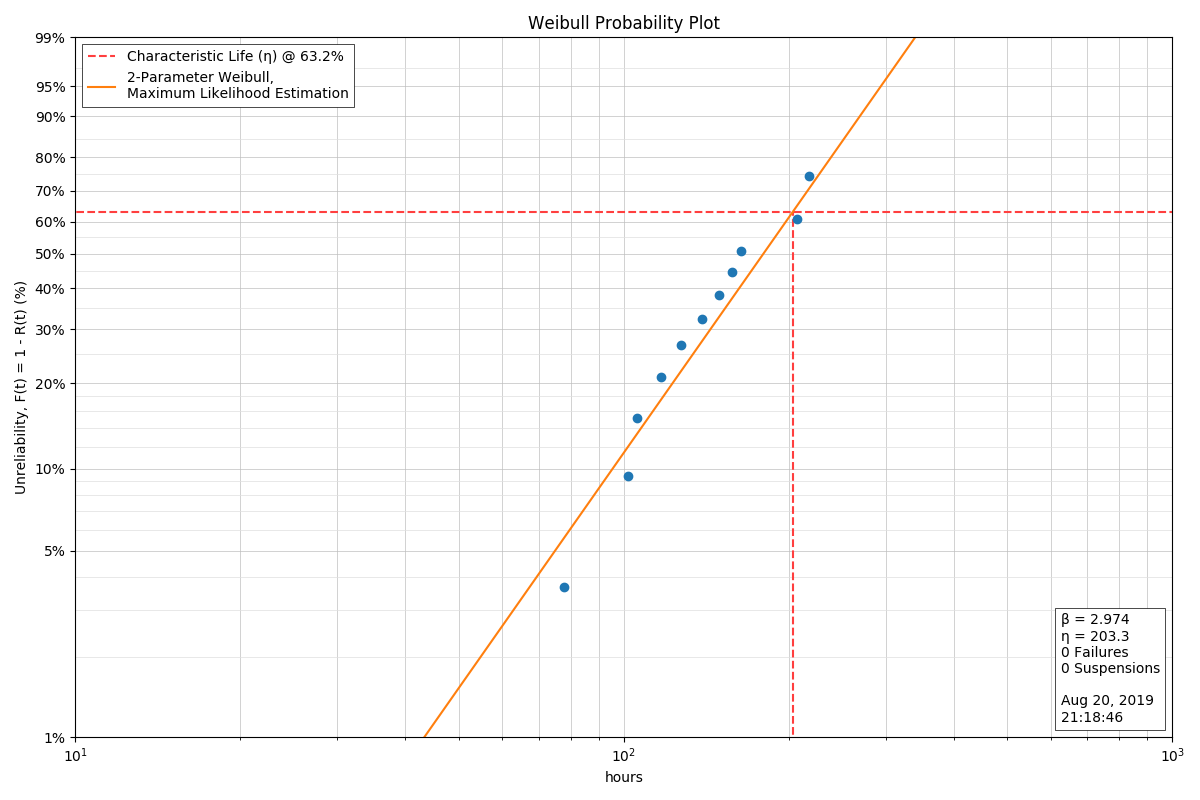
analysis.probplot(file_name='gallery-probplot.png')
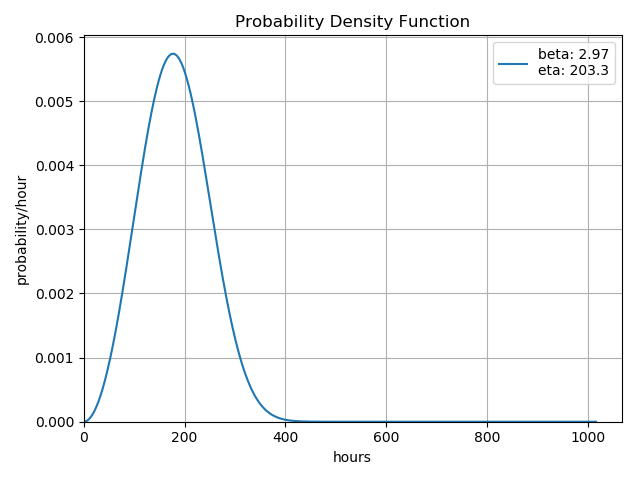
analysis.pdf(file_name='gallery-pdf.png')
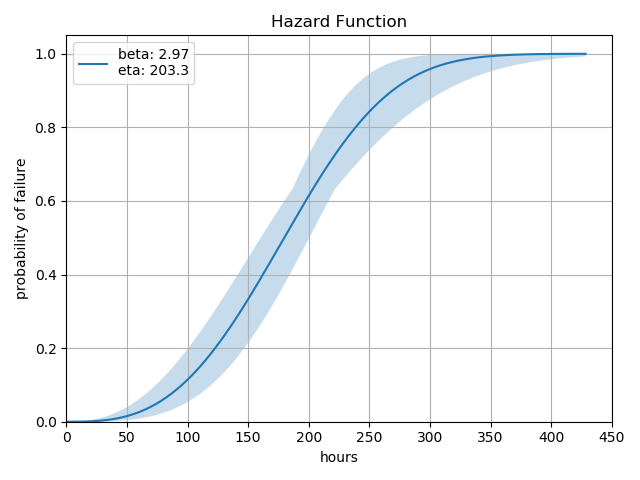
analysis.hazard(file_name='gallery-hazard.png')
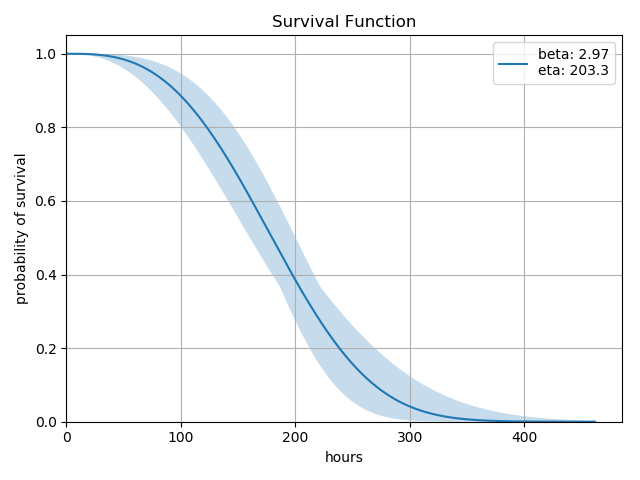
analysis.sf(file_name='gallery-survival.png')
analysis.fr(file_name='gallery-fr.png')